
Validation Data
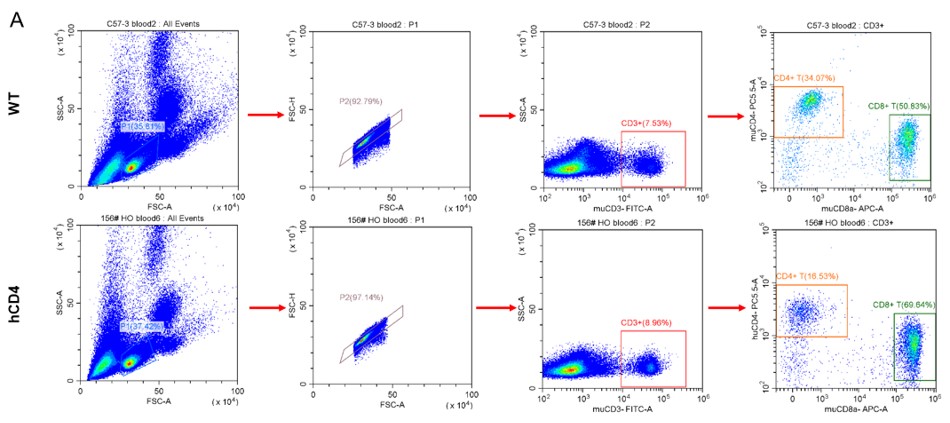
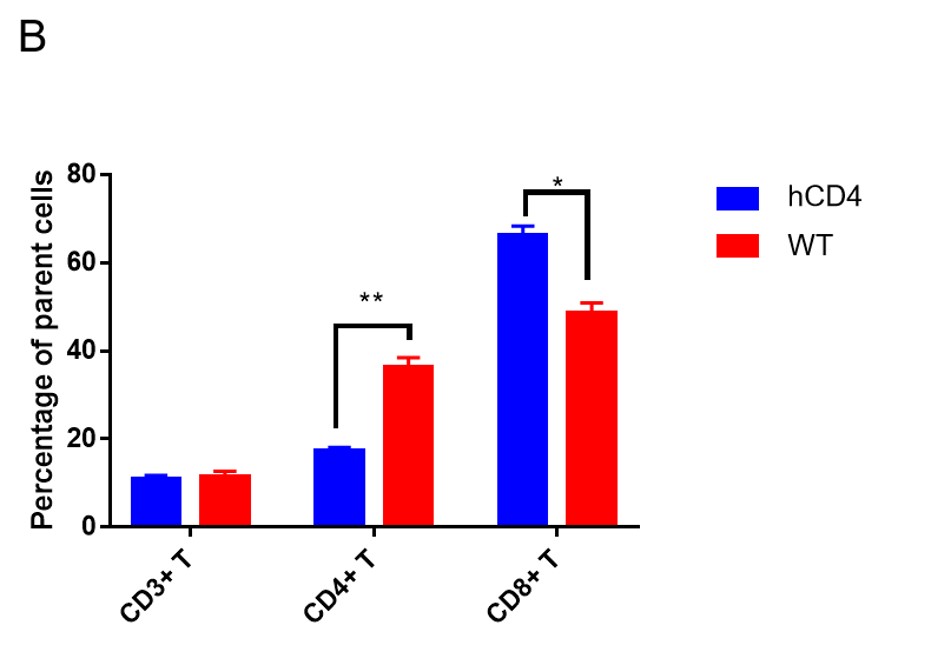
Figure 1. Flow cytometric analysis of the T cell subtype proportions in peripheral blood from control and the humanized CD4 mouse model.
A Lymphocyte dot plots. The gate for lymphocytes is indicated. B Statistical analyses of the CD8+ T cell and CD4+ T cell in the indicated groups. *P<0.05,**P<0.01.
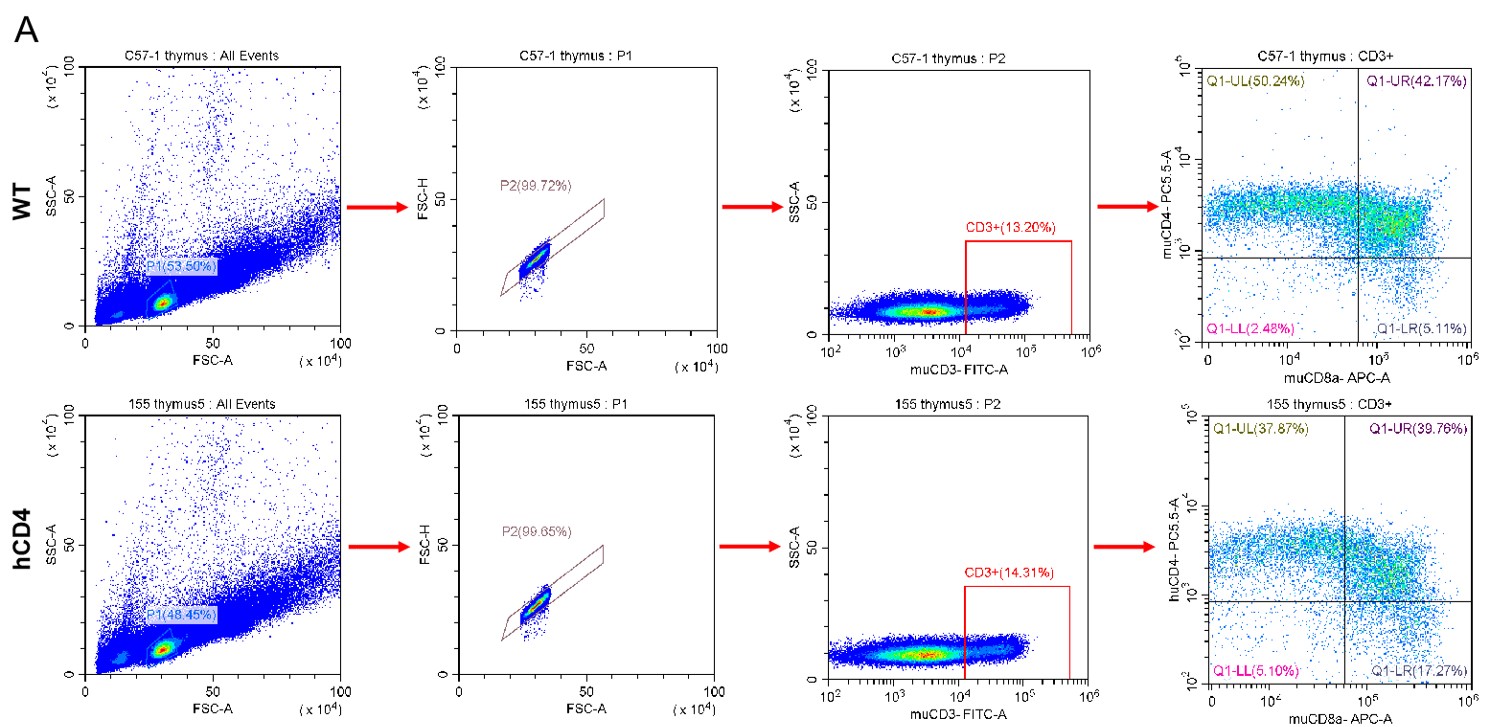
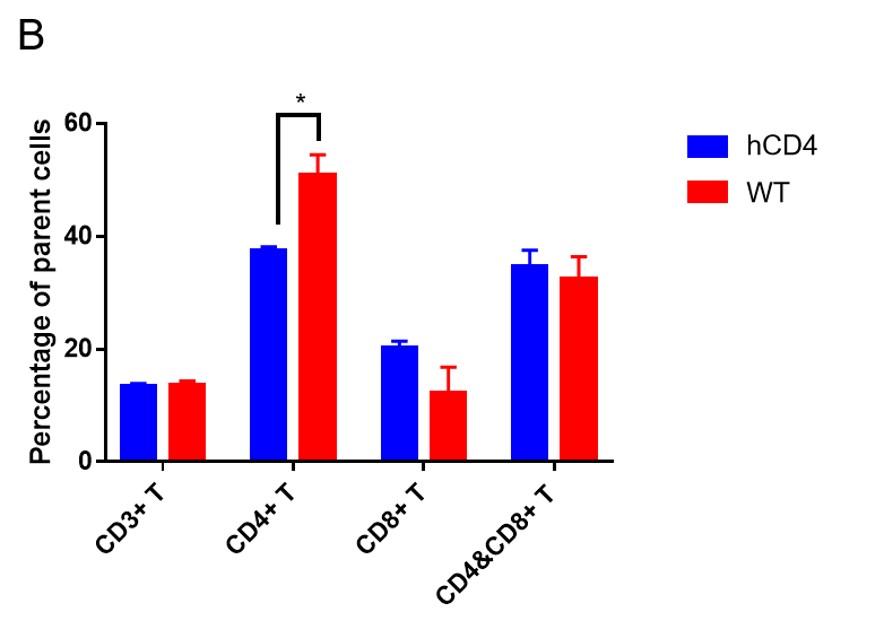
Figure 2. Flow cytometric analysis of the T cell subtype proportions in thymus from control and the humanized CD4 mouse model.
A Lymphocyte dot plots. The gate for lymphocytes is indicated. B Statistical analyses of the CD8+ T cell and CD4+ T cell in the indicated groups. *P<0.05.


Reviews
There are no reviews yet.